Most online shops that come to us can answer the question “how much do we spend on advertising?”. Far fewer can answer “how much can we afford to pay for an order?”. It is exactly that second number that decides whether performance marketing lifts an online shop up or slowly drains it dry.
This guide is written for online shop owners and marketers who want to know where to put their budget and why. It starts with margin, not channels, because that is the order in which it works.
What performance marketing is (and what it is not)
Performance marketing is a way of working in which every crown spent can be linked to a measurable result: an order, a registration or an enquiry. It is not a synonym for PPC. It is a method, not a channel.
The difference from brand communication is not the tool, but what you expect from it and when. Brand builds the demand that performance then harvests. If you harvest demand that nobody has sown, sooner or later you hit a ceiling. It is easy to spot: the cost per order rises while volume stays flat.
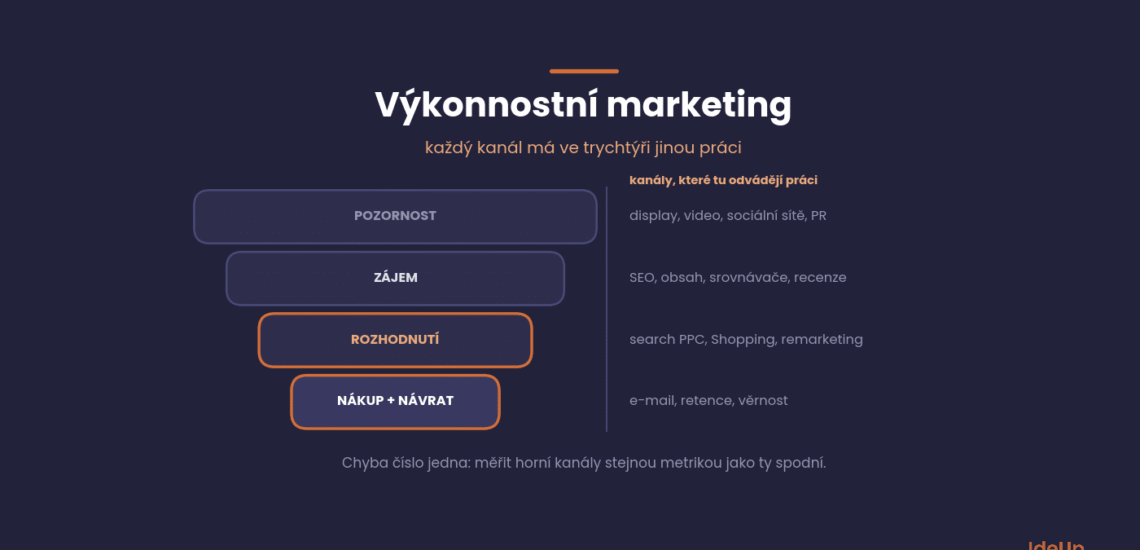
That is exactly why in e-commerce it makes no sense to compare channels with a single metric. Display and video do a different job from search campaigns on your brand name. If you measure them with the same ruler, you will switch off everything except the channels at the very bottom, and a year later you will wonder why demand is falling.
How performance marketing campaigns work
A performance marketing campaign ties your payment to an action you can count. Most advertising platforms and partner networks let you choose what you pay for.
- Cost per thousand impressions (CPM). You pay for reach. This is common for display and video.
- Cost per click (CPC). You pay when someone visits your site.
- Cost per acquisition (CPA). You pay for an order, a sign-up or an enquiry.
- Commission or revenue share. You pay a percentage of the sale. This is typical for affiliate partners.
The closer the payment is to the final sale, the less risk you carry. In return, you usually have less control over who sees your offer and in what context.
Whatever the model, a campaign follows the same cycle. You define the one action that counts, check that it is tracked, choose the audience and the offer, and launch with a test budget you can afford to lose. Then you compare the results with your break-even point and decide whether to scale, change or stop. For example, if you test with 1,000 USD and every order costs more than you can pay, you have bought useful information, not a failure.
Start with the numbers, not the channels

Before you open any advertising platform, you need four numbers. You can get them from your accounts and from your conversion data for the last twelve months.
- Average order value (AOV). Revenue divided by the number of orders.
- Gross margin. How much of that revenue you actually keep after the purchase price and direct costs (shipping, payment gateway, packaging, returns).
- Customer acquisition cost. In other words CAC, marketing spend divided by the number of new customers.
- Customer lifetime value. CLV tells you how much a customer spends with you over the whole relationship, not just the first time.
From these you calculate the threshold below which an order pays off. Here is the example that usually shows it best: an average order of 2,400 CZK (about 110 USD) and a gross margin of 35%, which is 840 CZK (about 39 USD). If you pay 520 CZK (about 24 USD) per order, 320 CZK (about 15 USD) is left for overheads and profit. The break-even point works out at a ROAS of 2.9. Everything below that loses money, even if it shows green in your ad account.
Now the important part: if your customers buy repeatedly, you can afford to sell the first order even below the threshold, because the second and third orders pay for it. Without knowing your CLV this is a gamble; with it, it is a strategy. This is the most common reason why two online shops in the same sector work with completely different budgets and both are right.
Channels and their roles
Each channel has a different job in the funnel and a different metric. Here is a breakdown of what to expect from each.
Search campaigns and Shopping
Search PPC advertising and product campaigns in Google Ads capture demand that already exists. That is why they tend to have the best numbers and why you start with them. But watch out for a trap: a large share of the performance usually comes from your own brand name, in other words from people who would have found you anyway. Separate brand and non-brand campaigns right at the start, otherwise you will be congratulating yourself on results you did not create.
SEO and content
Organic search is the only channel where the cost per visit falls as volume grows, rather than rising. The drawback is the ramp-up: first results in three to six months, full effect within a year. The advantage is that it does not stop when you switch off the budget.
For an online shop, SEO is not done on the blog, but on categories and filters. That is where searches with purchase intent are aimed. The foundation is thorough keyword research, which gives you the site structure, together with copy that is not written for a robot. Bear in mind that the rules are changing: answers in search are increasingly put together by artificial intelligence, and some searches never reach a click at all. This is what GEO deals with.
Remarketing
Remarketing finishes what other channels started. It can look great in a report while bringing in no new revenue, because it targets people who would have bought without it. Keep it, but do not judge overall performance by it.
Email and retention
Email marketing is by far the cheapest channel for the second and third order. Automations such as abandoned basket, post-purchase or reactivation of inactive customers are often the quickest untapped opportunity an online shop has. The cost is a fraction, because you have already paid for the database.
Price comparison sites and affiliate
Heureka, Zboží and affiliate sit close to the bottom of the funnel in economic terms. They work well for goods where price and availability decide. They are weaker for products sold through a story or advice.
Where to put your budget by stage of your online shop
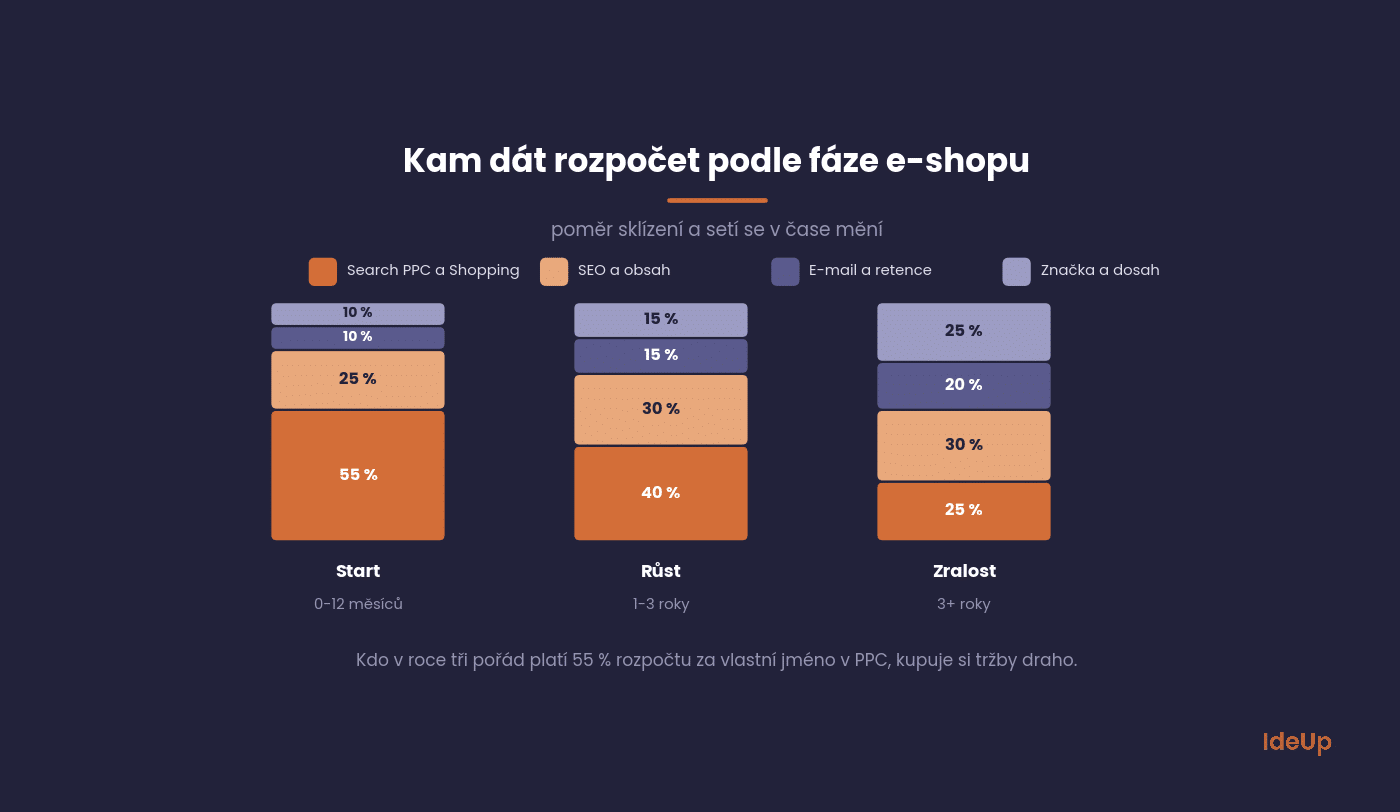
There is no single right mix, but there is a logic that repeats.
Launch (0 to 12 months). Above all you need data and your first revenue. Most of the budget goes into search and product campaigns, because they deliver results fastest. SEO gets going at the same time, but do not expect numbers from it in this period.
Growth (1 to 3 years). Organic starts to deliver, and it is time to move part of the money from paid search into content and email. At the same time there is room for brand building, because without it you will hit a demand ceiling.
Maturity (3 years and more). The share of performance falls, not because it has stopped working, but because demand is now largely created by the brand and organic search. Anyone who is still paying half their budget for their own name in PPC at this point is buying revenue at an unnecessarily high price.
What to report so that it is actually useful
The reports we see from new clients tend to have thirty numbers and zero decisions. We recommend the opposite: five metrics, each with a comment on what we will do about it.
- Revenue and number of orders, split into new and returning customers.
- Cost per order against your break-even point. Not against an industry benchmark.
- Share of brand and non-brand demand. Is interest in your brand growing, or are you just buying ever more expensive clicks?
- Conversion rate by channel and device. A drop on mobile is the most common silent killer.
- Share of repeat purchases. The cheapest growth is growth you do not have to buy again.
Performance marketing metrics and what each one tells you
The five numbers above are for decisions. Behind them sit diagnostic metrics that tell you why a number moved. These are the key performance indicators in digital marketing that you will meet most often.
- Click-through rate (CTR). Clicks divided by impressions. It shows whether your ad and offer interest the people who see them.
- Cost per acquisition (CPA). Spend divided by conversions. It is the number you compare with your break-even point.
- Return on ad spend (ROAS). Revenue from ads divided by ad spend, as reported by each channel.
- Marketing efficiency ratio (MER). Total revenue divided by total marketing spend. It ignores which channel claims the sale, so it is harder to flatter.
- CLV to CAC ratio. How much a customer is worth compared with what it cost to win them. It tells you how hard you can push on acquisition.
Read them in pairs. A rising CTR with a falling conversion rate usually points to a gap between what the ad promises and what the page delivers.
Measuring marketing performance across channels
Each platform measures its own contribution and counts the sales it touched. If you add up the conversions reported by every channel, the total is often higher than the number of orders in your shop. That is why performance marketing measurement should start from your own order data and only then look at what each channel claims.
Attribution models split the credit in different ways. First click rewards the channel that brought the customer in. Linear spreads the credit evenly across every touch. Data-driven models weight each touch by its observed effect. No model is the truth. Each one is a different view, and comparing them shows you which channels open journeys and which close them.
The most reliable check is an incrementality test. You switch off a channel for one region, or hold back a group of customers from a campaign, and compare their sales with the rest. The difference is what the channel really adds. Run such a test for long enough to cover your typical buying cycle, otherwise you will measure noise.
Five mistakes that cost the most money
- Budgeting by ROAS without knowing your margin. A ROAS of 6 can be a loss and a ROAS of 3 a profit. It depends only on how much of the order you keep.
- Last click as the only view of attribution. It systematically undervalues upper-funnel channels and rewards remarketing for the work of others.
- Cutting SEO when you need to save. You save straight away and pay for it a year later, when organic search stops bringing you people.
- Advertising to a website that does not convert. A higher budget at a conversion rate of 0.4% just spends money faster. Fix your landing pages, shipping and basket first.
- Switching off campaigns because of a weekly fluctuation. With a longer customer journey, a week is noise, not signal.
The first 90 days, how to get started
- Weeks 1 and 2: measurement. Check that conversions are tracked correctly, and calculate your margin and break-even point.
- Weeks 3 and 4: split brand and non-brand campaigns, launch product campaigns, and cut whatever is below the threshold.
- Month 2: email automations (abandoned basket, post-purchase, reactivation). The fastest return on the whole list.
- Months 2 and 3: keyword research and fixing the category structure. The foundation for organic search that will deliver from six months onwards.
- Month 3: first evaluation against the break-even point, not against the previous month.
Budget questions
Questions that come up in almost every budget meeting.
What budget does a new online shop need?
Instead of a figure, work out how many orders a month you need and how much you can pay for each one. Multiply them. That is your ceiling, not a flat amount an agency recommends.
Is SEO worth it for an online shop if I already run PPC?
Yes, but not immediately. PPC is rent, SEO is a mortgage. Most online shops that stop paying rent find they have nowhere to live.
What is a good ROAS?
One that is above your break-even point. Someone else’s benchmark tells you nothing, because it knows neither your margin nor your share of repeat purchases.
When should I start building a brand?
When your cost per order keeps rising despite optimised campaigns. That is a sign you are harvesting demand that nobody is replenishing.
How can I tell whether my agency reports well?
By whether you find decisions in the report, not just numbers. And whether the numbers are measured against your margin.
Where to start in your case
Performance marketing for an online shop rests on three things: knowing your unit economics, giving each channel a role it can actually handle, and changing the budget split as the online shop matures. None of this requires the biggest budget on the market, just numbers in order.
At IdeUp we build performance marketing for online shops in exactly this order, from margin through channels to SEO, which keeps costs down in the long term. Want to find out where you are losing money today? Get in touch through our contact page or take a look at our services.
Frequently asked questions about performance marketing
What is a performance marketing campaign?
It is a campaign where you pay for, and judge it by, a measurable action such as an order, a sign-up or an enquiry. The payment can be per click, per impression, per conversion or a commission on the sale. What makes it performance marketing is that you compare the result with what you can afford to pay.
What are the key performance indicators in digital marketing?
The most common are click-through rate, conversion rate, cost per acquisition, return on ad spend and customer lifetime value. For decisions, the most useful ones are those you can compare with your margin, such as cost per order against your break-even point. The rest help you find out why a result changed.
How do you measure marketing performance?
Start with your own revenue and order data, not with what each platform reports. Compare your total marketing spend with total revenue, then look at channel reports and attribution models to see each channel’s role. To find out what a channel really adds, run a test where part of your audience or market does not see it.
Which performance marketing metrics matter most for an online shop?
Cost per order against your break-even point, the share of new and returning customers, and the ratio of customer lifetime value to acquisition cost. These tell you whether growth is profitable. Metrics such as clicks or impressions are useful only for diagnosing problems.
USD amounts are approximate, converted at the Czech National Bank rate of 21.75 CZK per USD on 9 October 2026.