
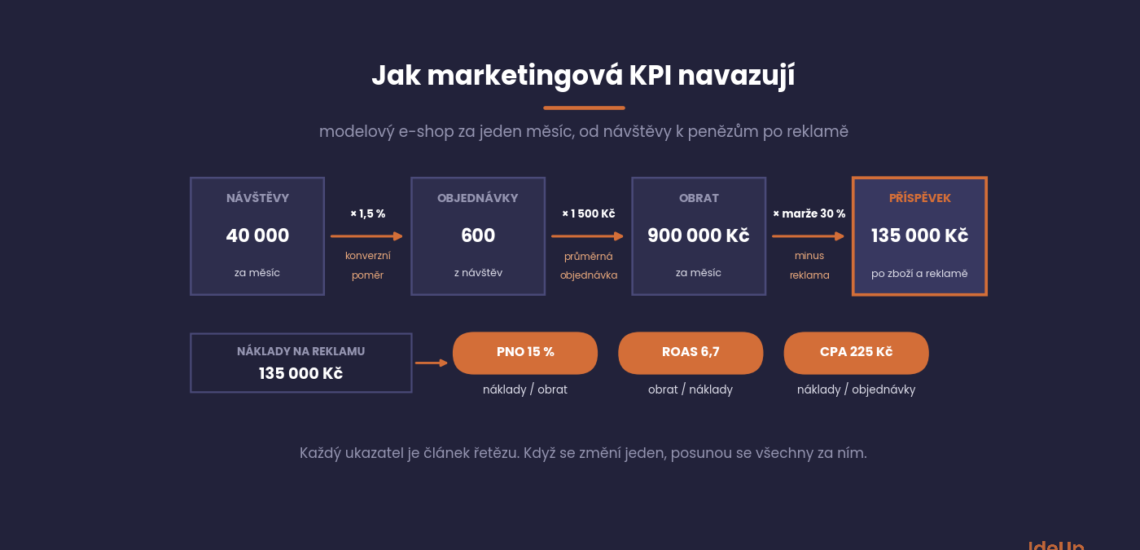
A KPI (key performance indicator, in Czech klíčový ukazatel výkonnosti) is a number that tells a company whether it is meeting its goal and that it then uses to make decisions. In marketing, it is typically the cost per order, the cost of sales as a share of revenue (PNO), the conversion rate or the cost per closed deal.
A KPI differs from an ordinary metric in that it has a target value and is based on strategy, not on whatever analytics happens to be able to measure. How to choose KPIs and how many a company can handle is covered in our general entry on KPI. Here we stay with marketing, with formulas calculated on a single model online shop, and with when each number is misleading.
KPI, metric, goal and OKR, how they differ
These four terms are often confused in briefs for agencies. The difference lies in whether a number only describes the current state or is used to make decisions, and how long a period it applies to.
| Term | What it is | Online shop example |
|---|---|---|
| Metric | anything that can be measured | 40,000 visits a month |
| KPI | a metric with a target value used to make decisions | PNO up to 18% |
| Goal | the result the company wants to achieve | revenue of 12 million CZK (about 550,000 USD) a year |
| OKR | a quarterly framework, one qualitative objective and three to five measurable key results | be the first choice in Brno, share of search from 12 to 18% |
A KPI checks whether the business is running healthily and is monitored continuously. An OKR is used to drive change, has a deadline and ends after the quarter. An achieved OKR result often becomes a new KPI, so companies that use OKRs usually have both. Click-through rate or follower count are usually just metrics. They become KPIs once they are given a target value and you change your budget or creative based on them.
Twelve marketing KPIs with formulas
The table uses one model online shop and one B2B campaign, and the numbers build on each other. The last column shows when an indicator leads to a wrong decision. For most of them, this matters more than the formula itself. The first eight indicators follow the order in which they build up in an online shop, from visit to customer value. The next two belong to services and B2B, and the last two measure the brand, not sales.
| Indicator | Formula | Example | When it misleads |
|---|---|---|---|
| Conversion rate | orders / visits × 100 | 600 / 40 000 = 1,5 % | the site-wide average hides a channel that does not sell |
| Average order value | revenue / orders | 900,000 / 600 = 1,500 CZK (about 69 USD) | one large order in a weak month skews it |
| Cost per order (CPA) | advertising costs / orders | 135,000 / 600 = 225 CZK (about 10 USD) | it ignores margin, so even a cheaply acquired order can be loss-making |
| PNO (cost of sales as a share of revenue) | advertising costs / revenue × 100 | 135 000 / 900 000 = 15 % | without knowing your margin, you cannot tell whether 15% is low or high |
| ROAS | revenue / advertising costs | 900 000 / 135 000 = 6,7 | it also counts purchases that would have happened anyway, typically from brand name campaigns |
| Contribution after marketing | revenue × margin minus costs | 270,000 minus 135,000 = 135,000 CZK (about 6,200 USD) | it does not mislead, but marketing often does not calculate it because it does not know the margin |
| Customer acquisition cost (CAC) | marketing costs / new customers | 135,000 / 360 = 375 CZK (about 17 USD), advertising only | without the agency, tools and salaries, it comes out too low |
| Customer lifetime value (CLV) | average order value × number of purchases × margin | 1,500 × 2.4 × 30% = 1,080 CZK (about 50 USD) | for a new online shop, the number of purchases is an estimate, not data |
| Cost per lead (CPL) | costs / enquiries | 40,000 / 100 = 400 CZK (about 18 USD) | it rewards the number of enquiries, not their quality |
| Cost per closed deal | costs / closed deals | 40,000 / 4 = 10,000 CZK (about 460 USD) | with a long sales cycle, deals keep coming in months after the campaign |
| Share of search | searches for your brand / searches for all brands in the sector × 100 | 2 400 / 12 000 = 20 % | in a small sector, monthly fluctuations are just noise |
| Share of mentions in AI answers | answers mentioning the brand / tracked answers × 100 | 18 / 60 = 30 % | once the set of queries changes, results can no longer be compared |
CLV and CAC make sense mainly together. If the customer’s value in margin does not cover the cost of acquiring them, every new customer costs you money, even if revenue is growing. In the example, it is 1,080 CZK (about 50 USD) against 375 CZK (about 17 USD), just under three times as much. With full marketing costs, the ratio would come out worse.
It pays to break the conversion rate down by traffic source and device. Where orders are most often lost and why the conversion rate raises revenue faster than traffic is described in a separate article.
Online and performance marketing KPIs by channel
The twelve indicators above describe the business as a whole. When you manage individual channels, each one needs a KPI that matches its role. A channel that starts the first contact should not be judged by the same number as a channel that closes the sale.
- Paid ads, cost per order or PNO for each campaign, compared with the account average.
- Email, revenue or enquiries per email sent, and the unsubscribe rate after each campaign.
- Social media, cost per visit to the website for paid posts, and the orders or enquiries the channel brought in.
- Content and blog, the share of visits that continue to a product or contact page, and enquiries that started on a content page.
- Website, conversion rate by device and the share of abandoned carts or forms.
Performance marketing KPIs are worth checking weekly, because you can move budget between campaigns quickly. Brand and content KPIs change slowly, so a monthly or quarterly review is enough. Judging them every week only shows you noise.
How the numbers connect in one online shop
Marketing KPIs form a single chain. Visits times conversion rate give orders, orders times average order value give revenue, and revenue and costs give both PNO and contribution after marketing. The model online shop from the table has a gross margin of 30% and spends 135,000 CZK (about 6,200 USD) a month on advertising. From revenue of 900,000 CZK (about 41,000 USD), it has 135,000 CZK (about 6,200 USD) left after paying for goods and advertising. This is the starting point we will adjust.
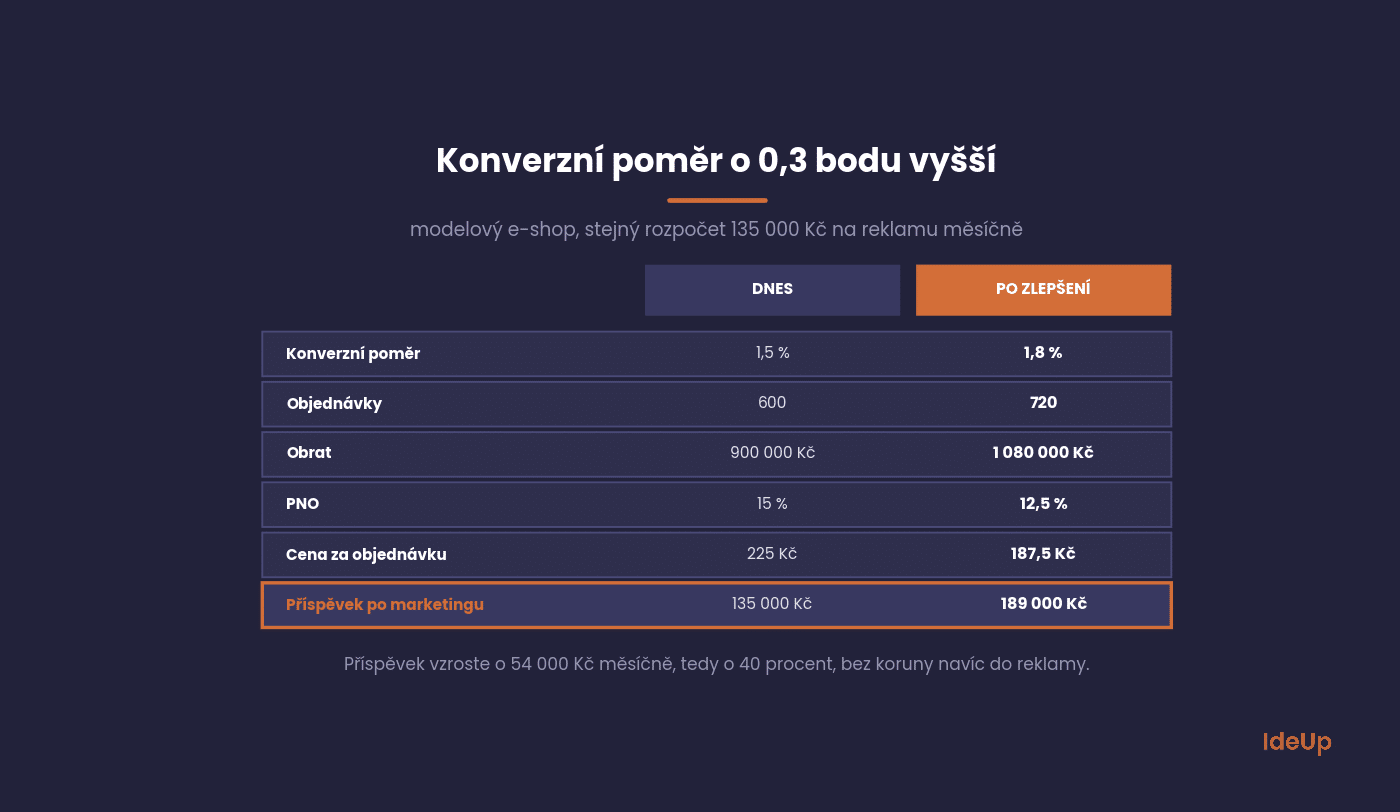
Now imagine the online shop speeds up its checkout and raises the conversion rate to 1.8%. With the same budget, 720 orders come in, revenue rises to 1,080,000 CZK (about 50,000 USD) and PNO falls to 12.5%. Contribution after marketing jumps to 189,000 CZK (about 8,700 USD), an increase of 54,000 CZK (about 2,500 USD) a month.
PNO can also be reduced in other ways, for example by switching off campaigns that have a higher PNO than the rest of the account but are still profitable. The number then looks better, but revenue and contribution in crowns both fall. That is why contribution after marketing belongs in the report next to PNO, as it shows this difference.
PNO and ROAS are one number seen from two sides
PNO (podíl nákladů na obratu) is the Czech name for an indicator known abroad, for example in Amazon advertising, as ACoS. It shows what percentage of revenue is consumed by advertising. ROAS calculates the same thing the other way round, that is, how many crowns of revenue one crown spent on advertising brings in.
The conversion is simple: ROAS is 100 divided by PNO as a percentage. A PNO of 20% therefore corresponds to a ROAS of 5, i.e. 500%, a PNO of 25% corresponds to a ROAS of 4, and a PNO of 10% to a ROAS of 10. If one agency reports PNO to you and another reports ROAS, they are talking about the same number.
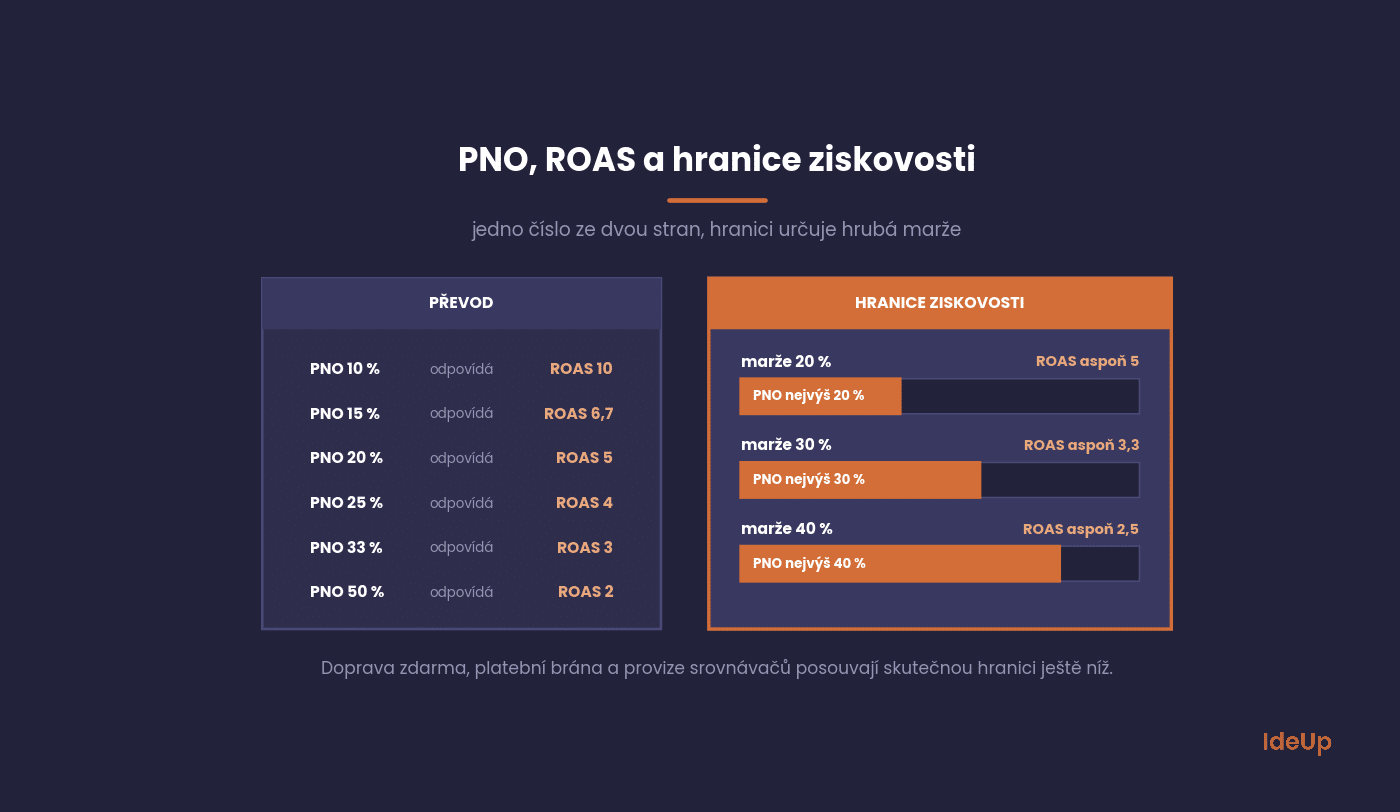
More important than the conversion is the break-even point. It lies at the PNO equal to the gross margin. With a 30% margin, advertising with a PNO of 30% costs you the entire gross profit from the orders it brought in. With a 20% margin, the break-even point is already at a PNO of 20%, i.e. a ROAS of 5.
So you can only work out what PNO is good for you from your own margin. The real limit is even lower, because the margin also has to cover free shipping, the payment gateway or commissions to price comparison sites. How to build a budget from this according to the online shop’s stage is shown in our guide to performance marketing for online shops.
In services and B2B, the cost per closed deal is what counts
A company that sells services or supplies other businesses does not have orders in marketing, but enquiries. It is tempting to track the cost per lead because it is available immediately. But an enquiry is not yet a deal, and sales still have to close it.
Take two model campaigns, each costing 40,000 CZK (about 1,800 USD). Campaign A brings in 100 enquiries at 400 CZK (about 18 USD) each, and sales close 4% of them, i.e. 4 deals. Campaign B brings in only 40 enquiries at 1,000 CZK (about 46 USD) each, but 20% of them are closed, i.e. 8 deals.
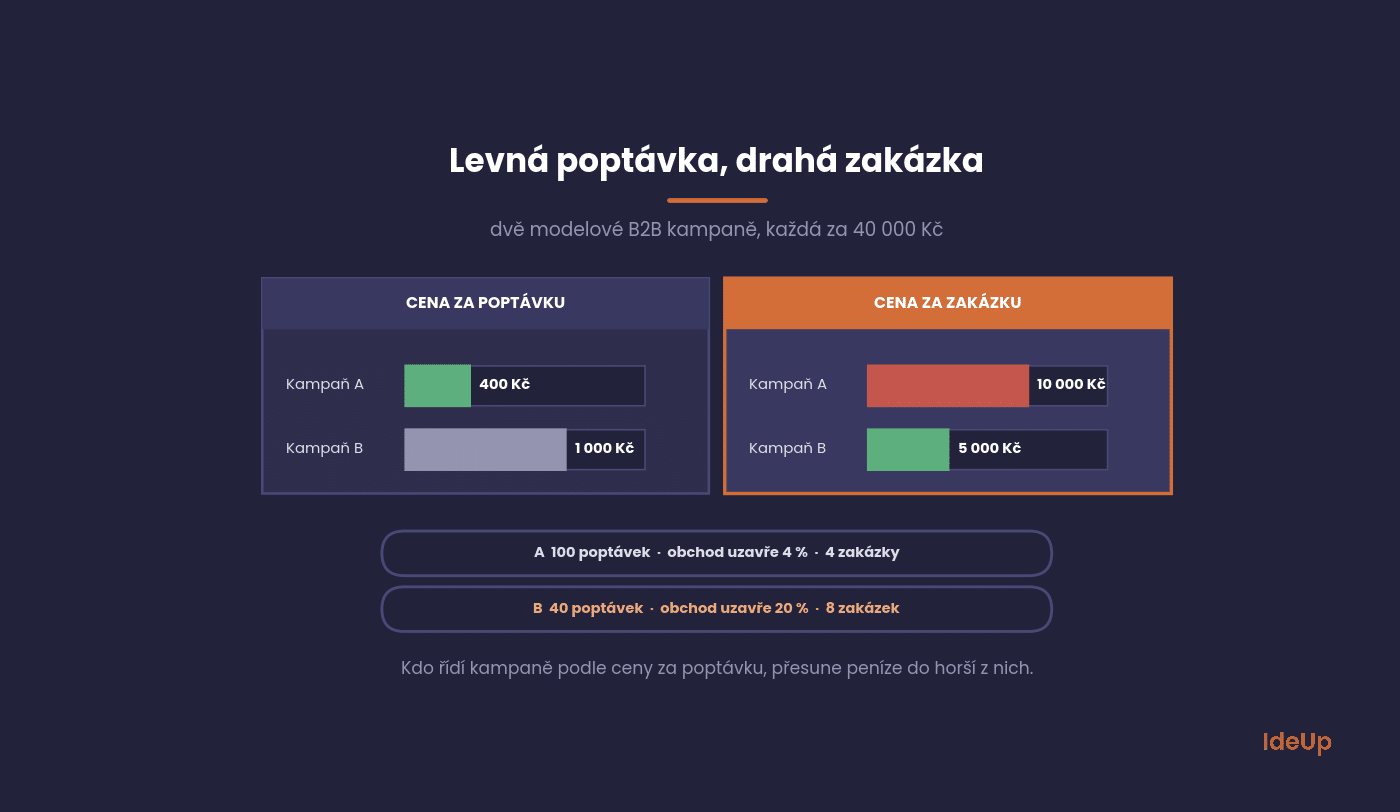
By cost per lead, campaign A is two and a half times cheaper. But it pays 10,000 CZK (about 460 USD) per deal, while campaign B pays only 5,000 CZK (about 230 USD). If decisions were based on cost per lead, the money would go to the campaign that brings in half as many deals for the same budget.
In practice, this means connecting marketing with sales. It is enough for sales to record, for each enquiry, where it came from and how it turned out. How to collect B2B enquiries that can actually be closed is described in our guide to B2B enquiries.
B2B marketing KPIs for a long sales cycle
When deals take months to close, the cost per closed deal arrives too late to steer a running campaign. You need indicators that warn you earlier and still reflect quality.
- Enquiry to opportunity rate, the share of enquiries that sales treat as a real opportunity. If it falls, marketing is bringing in the wrong companies.
- Pipeline created, the total value of opportunities from marketing in a period. If a campaign costing 5,000 USD creates opportunities worth 100,000 USD and you usually win a fifth of that value, you can expect around 20,000 USD in deals.
- Win rate by source, which shows which channels bring enquiries that sales can actually close.
- Sales cycle length by source, because a channel with slower deals ties up sales time for longer.
- CAC payback, the number of months of customer margin needed to cover the acquisition cost. With a CAC of 6,000 USD and a monthly margin of 500 USD, it is 12 months.
KPIs for brand, PR and AI answers
Brand campaigns and PR show up in revenue with a delay, so they cannot be judged by cost per order.
The most accessible is branded search, that is, how many times people search for your company’s name. Search Console shows it roughly for free as impressions for queries containing the brand name. Share of search tells you more: you divide searches for your brand by searches for all brands in the sector. It shows whether you are growing faster than the market.
In PR, the so-called AVE was used for a long time, that is, how much an article would have cost if it were paid advertising. AMEC, the International Association for the Measurement and Evaluation of Communication, runs a campaign for the complete abandonment of AVE, because it says nothing about the real result of communication. Instead, measure mentions in the media your target audience reads, and the links, visits and enquiries these mentions brought you.
AI answers have added another indicator. People ask ChatGPT, Gemini or Google with AI Overviews, and a brand missing from the answer often does not make it into their shortlist at all. That is why Patrik Pilous, SEO consultant at IdeUp, tracks the share of answers mentioning the brand on a fixed set of queries asked by customers in the given sector, for clients for whom we provide optimisation for AI search engines.
Why every tool shows a different number
Google Ads, Analytics, Sklik and the online shop’s admin almost never agree on the number of orders, because each tool counts according to different rules.
Google Ads attributes a purchase to the day the ad was clicked, Analytics to the day of the purchase. Someone who clicks on 28 September and buys on 3 October appears in September in Ads and in October in Analytics. Advertising systems also see only their own clicks, so a purchase that two of them contributed to is claimed by both. And each tool divides credit between channels according to a different attribution model.
So take revenue and order numbers from your e-shop admin or your accounts, and use advertising tools to compare campaigns with each other. As the main figure, we recommend total PNO (cost-to-revenue ratio), meaning all marketing costs divided by total revenue from the admin. Purchases counted twice in advertising systems will not distort it.
What to calculate first
You do not need a dashboard or a new tool to start. One afternoon is enough, plus figures for the last three months compared with the same period last year, so that seasonality does not distort the result.
- Pull revenue and the number of orders or contracts from your admin or your accounts.
- Add up all marketing costs, including the agency, tools and people.
- Calculate total PNO or, for service businesses, the cost per closed contract.
- Find out your gross margin so you know where the profitability threshold lies.
Only with these figures does it make sense to look at individual channels and campaigns. If you want to go through them with us and use them to set KPIs for advertising and SEO, book a consultation.
Common mistakes when setting marketing KPIs
- Too many KPIs. If a report has twenty headline numbers, nobody knows which one decides the budget.
- No target value. A number without a target only describes the past. You cannot tell whether to act.
- Targets copied from other companies. A good PNO or cost per deal depends on your margin and prices, not on someone else’s results.
- Rewarding a number that is easy to inflate. If a team or agency is paid by the number of enquiries, it will bring more enquiries, not more deals.
- Changing definitions during the year. If you change what counts as a lead or which costs go into CAC, compare old and new figures only after recalculating them.
Frequently asked questions about marketing KPIs
What are KPIs for marketing?
Marketing KPIs are the few numbers with a target value that you use to decide where your marketing budget goes. Typical ones are cost per order, PNO or ROAS, conversion rate and cost per closed deal. Other figures you track are just metrics that help explain why a KPI changed.
What are examples of KPIs in marketing?
For an online shop, common examples are conversion rate, average order value, cost per order, PNO and customer lifetime value. For B2B, they include cost per lead, enquiry to opportunity rate, win rate and cost per closed deal. For brand work, you can use awareness from regular surveys or the share of AI answers that mention your brand.
What are good brand marketing KPIs?
Good brand KPIs show whether more people know and choose you over time. You can track unaided awareness from repeated surveys, direct visits to your website, the share of returning customers and mentions in media your audience reads. Review them monthly or quarterly, because they move slowly.
How many marketing KPIs should you track?
Keep one main figure for the whole business, such as total PNO or cost per closed deal, and a small number of supporting KPIs for each channel. Everything else can stay as metrics in the background. If a number does not change any decision, it does not need to be a KPI.
USD amounts are approximate, converted at the Czech National Bank rate of 21.75 CZK per USD on 9 October 2026.


Leave A Reply